Customers do not experience a business as an organization chart: they discover an option, compare it, buy, receive, use, and sometimes request help or buy again. Designing this sequence reveals where value is delivered and lost. Customer journey, customer lifecycle, and conversion funnel are related but not interchangeable: a journey describes experiences and touchpoints; a lifecycle categorizes a relationship over time; a funnel simplifies conversion stages [R06][R17].
Define an actor, scenario, and outcome
Nielsen Norman Group identifies actor, scenario and expectations, phases, actions-thoughts-emotions, and opportunities as useful journey-map components [R06]. Choose a specific person or well-defined segment; do not mix buyers and users if they experience different journeys. To define the segment, see customer identification.
Sketch stages without imposing a perfectly linear path
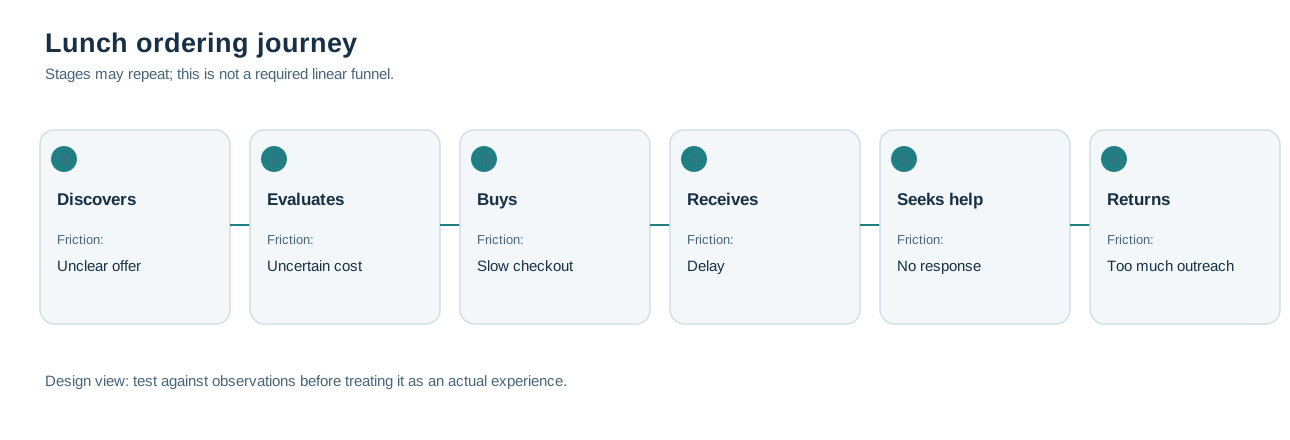
An initial sequence might be: discovery → evaluation → order → payment → receipt → use → support → repurchase or exit. People may return to comparing offers, leave, and come back weeks later. The map should reflect uncertainty rather than imply everyone completes the same sequence. Link it with sales and distribution channels.
Record actions, expectations, friction, and emotions
For each stage, ask: What is the customer trying to achieve? What do they do? Where do they interact? What information do they need? What might go wrong? Who or what should respond? Separate direct observations from anticipated experiences. When we invent feelings without research, the map is a design hypothesis, not a portrait of actual users.
| Hypothetical stage | Customer action | Touchpoint | Possible friction | Designed response |
|---|---|---|---|---|
| Discovery | Looks for nearby lunch | Search or recommendation | Unclear offer | Visible menu and coverage zone |
| Evaluation | Compares timing and price | Ordering page | Uncertain final price | Display full cost |
| Purchase | Chooses menu and pays | Checkout form | Slow process | Remove unnecessary steps |
| Delivery | Waits for order | Message and courier | Unexpected delay | Defined update and help |
| After-sales | Reports a problem | Support | No response | Clear resolution route |
| Repeat purchase | Decides whether to return | Optional reminder | Excessive messages | Useful, permission-based contact |
This map is an illustrative exercise, not a research result.
Design the relationship, not just the sale
A model may need self-service, personal help, onboarding support, a community, or dedicated account management. Each relationship entails different cost and trust requirements. Say who answers questions before payment, who handles incidents, and how much effort is needed to keep the promise. Customer relationships are one of the Business Model Canvas blocks [R01].
Distinguish journeys, funnels, and retention
A funnel can measure visitors, leads, opportunities, and sales, but those figures do not explain why a person leaves, whether the offer was delivered, or whether later experiences encourage a return. A customer journey includes doubts, transitions, effort, support, and emotions beyond a funnel. Running funnels, after-sales support, and loyalty programs belongs to pillar 6; retention measurement belongs to pillar 7 [R06][R17].
Look behind the scenes with an initial service blueprint
For each interaction, ask what visible activity and internal process make it possible. Confirming a delivery, for example, requires updated inventory, kitchen capacity, logistics assignment, and communication. NN/g uses service blueprints to connect customer actions with frontstage actions, backstage work, and support processes [R07]. Detailed execution belongs to capabilities design and later operations; connect this to key capabilities.
Choose meaningful friction points
Prioritize those that might break the value proposition or prevent an informed purchase: hidden pricing, missing support, or an unconfirmed delivery. Do not map a hundred screens when your main uncertainty is who will make the delivery. Record an owner and evidence gap for each opportunity.
Compare these friction points with the value proposition and its differentiation: not every inconvenience along the journey has the same effect on the outcome the business intends to deliver.
Mistakes and limitations
Avoid mistaking a marketing journey for the entire usage experience; claiming customers feel something without evidence; building a map so generic it fits every segment; or offering unlimited after-sales help without resources. Expected conversion rates remain hypotheses until behavior can be observed.
A practical way to review the map as a team
Walk through a complete purchase using the offer or a prototype: discover it, find the full price, attempt to buy, simulate a delay, and request help. Record unanswered questions and which actor must resolve them. Then invite representative people to perform real tasks, labeling what has been observed versus merely anticipated. When there are two roles—an employee receiving the lunch and an employer paying—map two linked viewpoints rather than inventing a hybrid persona. The resulting journey should inform design, not replace later user tests.
If the full service does not exist yet, choose a suitable prototype to test the experience without confusing an internal journey walkthrough with evidence of real user behavior.
What you should have when you finish
A journey map with actor and scenario, phases, actions, touchpoints, friction, opportunities, and initial responsibilities; plus a definition of how your business will interact with customers. Sources: [R06][R07][R17][R01].
Bibliography and references
- [R06] Nielsen Norman Group — Journey Mapping 101. https://www.nngroup.com/articles/journey-mapping-101/ — Actor, escenario, fases, acciones, emociones y oportunidades.
- [R17] OpenStax — Customer Relationship Management. https://openstax.org/books/principles-marketing/pages/1-6-customer-relationship-management-crm — Relaciones y seguimiento de clientes, retención.
- [R01] Strategyzer — The Business Model Canvas. https://www.strategyzer.com/library/the-business-model-canvas — Nueve bloques interdependientes y uso iterativo del Canvas.
- [R07] Nielsen Norman Group — Service Blueprints: Definition. https://www.nngroup.com/articles/service-blueprints-definition/ — Frontstage, backstage y procesos de soporte.