A business can record enough sales to show an operating profit while still lacking cash when suppliers must be paid.
Sales, revenue, receipts and available cash
A sale records a commercial transaction; a receipt indicates when cash actually arrives. An expense and a payment may also occur in different periods. Contribution margins and profit are examined in the business economics article. Here the focus is on money actually collected and paid, including startup investment and financing, without confusing borrowed capital with trading revenue. The Australian Government organizes cash flow around opening balance, incoming cash, outgoing cash and closing balance, with forecasts identified as estimates [R09].
Build a twelve-month cash forecast
- Set currency, periods, tax assumptions and opening cash date.
- Forecast sales volumes and prices, with scenarios clearly labeled as unvalidated where appropriate.
- Convert forecast sales into cash receipts using payment terms: upfront, card settlement, credit and delays.
- Estimate paid variable costs according to actual purchasing and stock replacement dates.
- Include fixed payments, wages, rent, debt service, applicable taxes and startup outlays in the periods when they occur.
- Record loans or equity injections separately and debt installments as outgoing cash.
- Calculate each closing balance and carry it forward as next month's opening balance.
- Inspect the lowest projected balance, collection delays and obligations that cannot be postponed.
- Reconcile forecasts with actual values and explain deviations each month.
The identity that must hold is closing cash = opening cash + receipts and funding − payments. Categories need to prevent duplicate recognition of the same transaction.
Worked example: positive operating result, negative cash
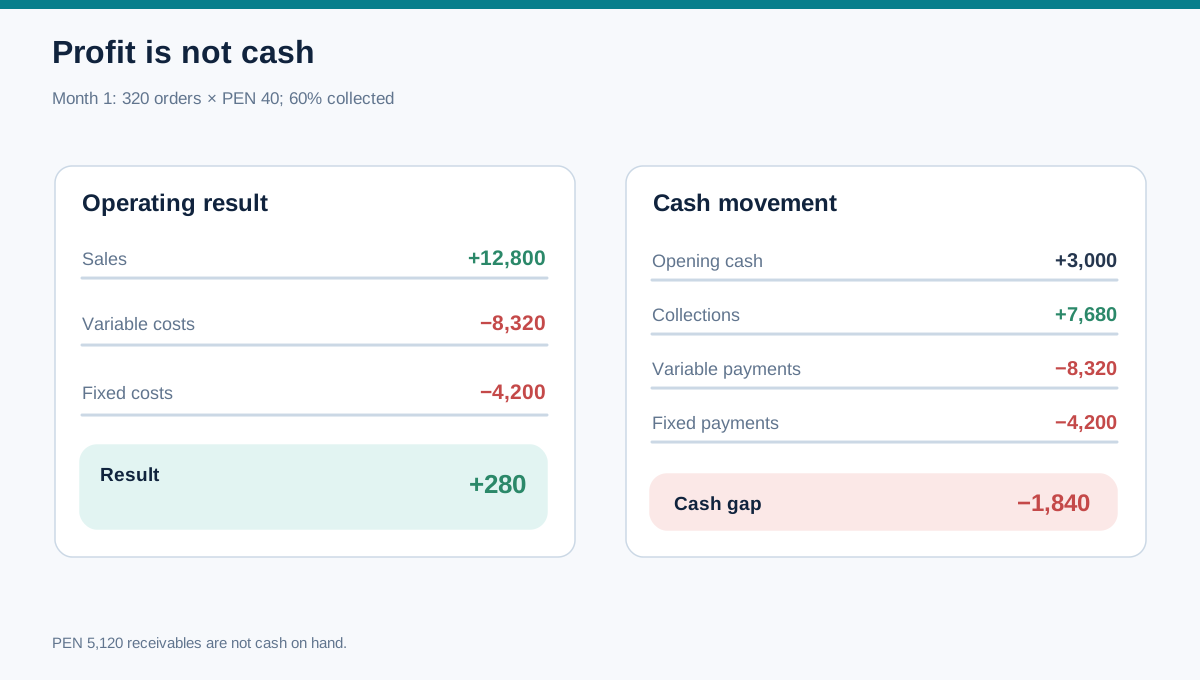
Use the hypothetical economics already introduced in pillar 2: PEN 40 price, PEN 26 variable cost per order and PEN 4,200 monthly fixed operating expenses. The PEN 12,500 initial payment belongs to the startup budget; after paying it, assume the business has PEN 3,000 operating cash.
In month one, 320 orders yield PEN 12,800 sales, PEN 8,320 variable costs and PEN 280 simplified operating surplus, before taxes and unmodeled items. But suppose only 60% of sales is collected in that month. Cash received is PEN 7,680; if all variable costs and fixed obligations are paid, cash payments total PEN 12,520. Closing cash is therefore PEN 3,000 + PEN 7,680 − PEN 12,520 = −PEN 1,840. This negative amount indicates a funding gap, not an assumption that a bank account can lawfully run an overdraft.
| Item | Month one, PEN |
|---|---|
| Opening cash after startup payments | 3,000 |
| Receipts (60% of 12,800) | 7,680 |
| Variable cost payments | −8,320 |
| Fixed cash payments | −4,200 |
| Closing cash before extra financing | −1,840 |
A further PEN 5,120 remains uncollected, subject to payment terms and default risk. The gap between accounting result and cash is the central lesson. The package workbook extends the forecast to twelve months with explicit assumptions. Do not assume an initial capital injection automatically covers later shortfalls; inspect the whole series.
Working capital, reserves and worst cumulative deficit
Working capital generally concerns current resources needed through the operating cycle. It is not the same as equipment spending or an arbitrary percentage of sales. To size starting cash, examine the cumulative cash gap and unavoidable payments before receipts. An operating reserve cushions ordinary fluctuations; a contingency reserve is tied to identified risk responses. Avoid counting one forecast loss in the cash gap, again in an operating reserve, and a third time in contingency.
To justify additional contingency cash, link it to risk responses and contingency plans identifying the triggering event and the action to fund. Do not add another generic buffer for the same shortage already included in the forecast.
If orders fall 20%, customers pay a month later or ingredients cost more, recalculate every projected balance. The forecast should show not only a central scenario but conditions calling for funding, reduced scope or a delayed pilot.
Common mistakes
Do not equate invoices with cash, accounting profit with bank balance, or founder funds with sales. Record taxes and card fees according to real jurisdiction and terms. Avoid extrapolating a small pilot into twelve months without disclosing the growth assumption.
Twelve-month forecast and three editable scenarios
The base case assumes 320 orders per month, PEN 40 selling price, PEN 26 unit variable cost, PEN 4,200 monthly fixed cost, 60% collected in the sale month, and the other 40% in the next month, with no bad debts. This is an illustrative cash model, not a verified demand forecast, and excludes taxes and seasonality for clarity.
| Variable or result, month 1 | Downside | Base | Upside |
|---|---|---|---|
| Orders | 240 | 320 | 400 |
| Same-month collection | 50% | 60% | 70% |
| Sales PEN | 9,600 | 12,800 | 16,000 |
| Cash receipts PEN | 4,800 | 7,680 | 11,200 |
| Variable payments PEN | 6,240 | 8,320 | 10,400 |
| Fixed payments PEN | 4,200 | 4,200 | 4,200 |
| Simplified operating result PEN | −840 | 280 | 1,400 |
| Opening cash PEN | 3,000 | 3,000 | 3,000 |
| Month-1 closing cash PEN | −2,640 | −1,840 | −400 |
In every case, closing cash = opening cash + receipts − payments. A sale enters the operating model, while the receipt follows actual collection terms. In month two, the outstanding 40%, 50%, or 30% of month-one sales arrives depending on the scenario, plus the in-month share of month-two sales. Never treat all sales as immediate cash.
The v2 books contain DownsideCash, BaseCash, and UpsideCash, each with twelve monthly rows and editable drivers. Change volume, price, variable and fixed costs, collection rate, and exceptional payments to see the minimum balance across the full horizon and funding gap. These three examples vary only volume and collection timing; also test higher variable costs, a full-month collection delay, multiple low-demand months, and an exceptional bill.
To interpret how those changes affect the economics of the business model, compare business-model viability scenarios. That analysis examines contribution and operating results under assumptions; the cash forecast also shows when money is collected or paid.
There is no universal “10% reserve” right for every business. Derive the operating cash reserve from documented obligations and volatility; distinguish it from contingencies for specific risks so the same buffer is not counted twice. Any negative projected balance requires confirmed funding or a viable operational change. The business.gov.au approach motivates the separation of balances, receipts, and payments [R09].
What you should have when you finish
Twelve linked monthly receipts, payments and cash balances, maximum projected funding gap, scenarios and a reasoned basis for cash and reserve requirements.
References: [R09], [R08], [R07].
Bibliography and references
- [R09] Australian Government — business.gov.au — Set up a cash flow statement. https://business.gov.au/finance/cash-flow/set-up-a-cash-flow-statement
- [R08] U.S. Small Business Administration — Calculate your startup costs. https://legacy.sba.gov/business-guide/plan-your-business/calculate-your-startup-costs
- [R07] U.S. Small Business Administration — Write your business plan. https://legacy.sba.gov/business-guide/plan-your-business/write-your-business-plan