An attractive offer can still lose money when revenue fails to cover the resources needed to deliver it. Managerial accounting uses contribution margin and cost-volume-profit analysis to estimate the activity required to cover fixed costs and explore sensitivity to change [R12][R13][R19]. This zoom-in is a preliminary decision model, not a set of financial statements or tax advice.
Step 1. Separate revenue, costs, and expenses
Revenue is the value of sales recognized under the applicable accounting policy; cash received is actual incoming cash. Variable cost changes with delivered units over the relevant range; fixed cost remains approximately constant during a stated period and relevant range. Some costs are mixed or stepwise: a second courier may increase capacity in a discrete jump. Exact accounting classification depends on applicable policies and standards [R13].
Step 2. Build variable cost per unit
Hypothetical Almuerzo Cerca, per lunch:
| Illustrative component | Cost per lunch |
|---|---|
| Ingredients | S/14 |
| Packaging | S/2 |
| Variable preparation labor | S/5 |
| Variable delivery | S/5 |
| Total variable cost | S/26 |
The assumption excludes platform commissions, taxes, discounts, returns, and exceptional waste; when relevant, account for them by channel and scenario. Do not double-count fixed and variable labor: classify it according to how staff are actually paid.
Step 3. Calculate contribution and margins
At a S/40 price, unit contribution is 40 − 26 = S/14. The ratio to sales is 14 / 40 = 35%. This does not mean the company earns a 35% net profit: rent, administration, and other fixed expenses remain. Gross margin, contribution margin, and net margin include different costs and have distinct definitions; specify which measure you are reporting [R13].
Step 4. Calculate the break-even point
Assume S/4,200 in monthly fixed costs over a period and volume range in which they remain unchanged. For one homogeneous unit, the formula is:
Break-even units = fixed costs / (unit price − unit variable cost)
4,200 / (40 − 26) = 300 lunches per month.
If there were 26 operating days, this would be approximately 11.54 lunches per day, meaning at least 12 per day on average under these assumptions; actual daily demand may vary. The SBA confirms the formula, and OpenStax discusses its range of application [R12][R13].
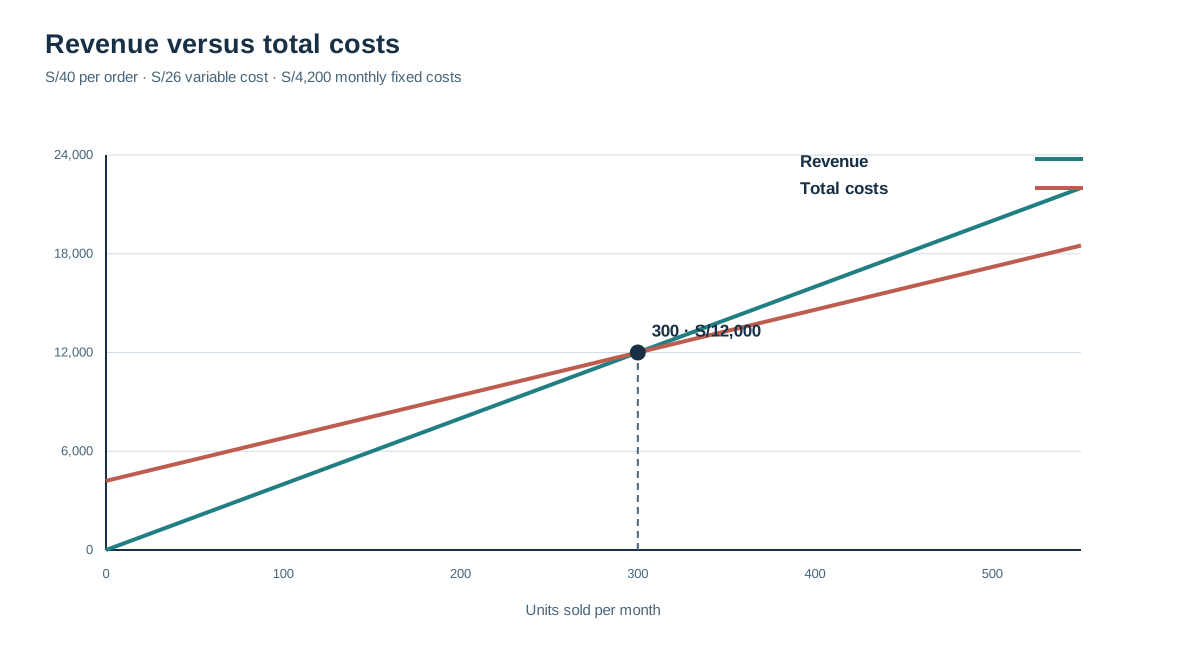
| Monthly units | Revenue | Variable costs | Fixed costs | Simplified result |
|---|---|---|---|---|
| 200 | S/8,000 | S/5,200 | S/4,200 | −S/1,400 |
| 300 | S/12,000 | S/7,800 | S/4,200 | S/0 |
| 400 | S/16,000 | S/10,400 | S/4,200 | S/1,400 |
| 500 | S/20,000 | S/13,000 | S/4,200 | S/2,800 |
The table excludes initial investment, taxes, interest, depreciation, potential extra waste, and maximum capacity. Do not use it unadjusted as a real financial budget.
Operating break-even does not include every cash outlay needed to get started. Before committing funds, complete the initial investment and startup-cost budget, which separates equipment, preparation, initial inventory, and cash requirements.
Step 5. Examine customer and channel unit economics
A transaction may have positive contribution yet be unsustainable if acquiring that customer is too expensive. If you pay for ads, identify the attributable acquisition cost without confusing traffic with acquired customers. Do not invent lifetime value using unobserved repeat purchases. If a platform charges an extra S/8 per order on top of S/26 variable costs, contribution falls from S/14 to S/6, assuming unchanged price and other costs; that channel may require a different break-even point. See sustainable channels.
Cost and customer-behavior assumptions should become economic viability hypotheses before a scenario is treated as sustainable.
Step 6. Separate profit from liquidity
A business can report a positive operating result and still run short of cash if a corporate customer pays in 45 days while wages and ingredients are paid earlier. IAS 7 separates operating, investing, and financing cash flows [R14]. Prepare a calendar of receipts, payments, inventory, and cash reserves. Customer prepayments also do not necessarily mean all related revenue has been earned. Working capital requirements depend on actual terms and operating cycles, not simply monthly profit.
A positive projected operating result does not prove that cash will be available when salaries, supplies, or debt payments fall due. The twelve-month cash and reserves exercise translates sales into receipt dates and expenses into payments, revealing potential financing or operational adjustments.
Step 7. Account for product mix and capacity
When different meals have different contributions, the simple S/14 break-even value does not cover the whole business: use an expected sales mix or composite units. If the kitchen cannot produce 300 lunches monthly without more staff, assumed fixed costs are wrong for that volume. OpenStax covers sales-mix effects and relevant ranges [R13]. Assess business capabilities.
Errors and controls
Never divide by zero or negative contribution; if price ≤ variable cost, selling more does not cover fixed costs under that model. Do not mistake revenue for margin, margin for cash, or pre-tax price for billed price. Include relevant overhead and keep assumptions within the same period. To explore volume and price changes, continue with viability scenarios.
Minimum controls for an auditable spreadsheet
Every figure should show its period, unit, currency, assumption, and source. “S/26 cost” is incomplete without stating that it means one delivered lunch, what it includes, and whether delivery is variable. Use formulas for contribution and break-even rather than manually typed results. Add a warning when price minus variable cost is zero or negative. Save a new version when assumptions change so you can explain why break-even moved away from 300. Transparent calculations are more useful than a table with apparent precision.
What you should have when you finish
A reproducible table of variable costs, contribution, fixed costs, break-even, basic sensitivity, capacity, and payment timing, with assumptions and exclusions stated. Sources: [R12][R13][R14][R19].
Bibliography and references
- [R12] U.S. Small Business Administration — Break-even point calculator. https://www.sba.gov/counseling/plan-your-business/break-even-point-calculator/ — Fórmula de punto de equilibrio y supuestos.
- [R13] OpenStax — Managerial Accounting, Chapter 3 Summary. https://openstax.org/books/principles-managerial-accounting/pages/3-summary — Margen de contribución, punto de equilibrio, mezcla y sensibilidad.
- [R19] OpenStax — Break-Even Sensitivity Analysis. https://openstax.org/books/principles-managerial-accounting/pages/3-3-perform-break-even-sensitivity-analysis-for-a-single-product-under-changing-business-situations — Cambios de precio, volumen y costos en escenarios.
- [R14] IFRS Foundation — IAS 7 Statement of Cash Flows. https://www.ifrs.org/issued-standards/list-of-standards/ias-7-statement-of-cash-flows/ — Clasificación de flujos operativos, de inversión y financiación.