A business model is not viable just because its revenues and costs fit in a spreadsheet. It must withstand questions about demand, price, capacity, payment timing, and dependencies. Managerial accounting sensitivity analysis explores how results change when unit price, sales volume, variable costs, or fixed costs change [R13][R19]. A scenario is an explicit set of compatible assumptions, not a forecast.
First, check that the decisions fit together
Make sure the Business Model Canvas targets the same segment as the value proposition; that channels support the intended sale; that prices allow a reasonable contribution; and that resources and partners can deliver. An operating contradiction can invalidate apparently positive financial figures.
Step 1. Find the variables that actually matter
Record effective average unit price, volume, variable cost, fixed costs, capacity, channel mix, commissions, refunds, and timing of collections. State where each assumption comes from. Avoid producing scenarios that change ten numbers without explaining why. Demand assumptions should use explicit market estimates, without treating them as facts.
Step 2. Build four distinct scenarios
A conservative case considers unfavorable but plausible conditions; the central case represents the working assumption; the favorable case explores better conditions; the severe downside asks what happens if several critical conditions deteriorate together. This structure is a practical comparison structure, not a compulsory naming system or a statistical forecast.
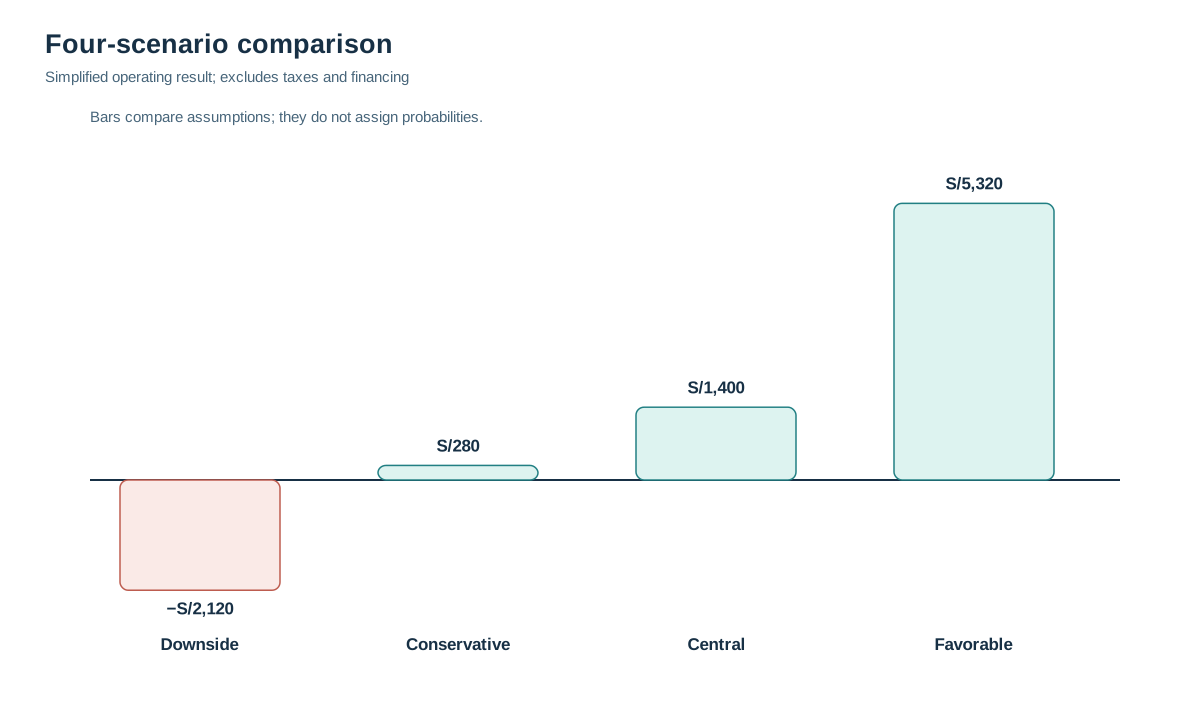
Completely hypothetical Almuerzo Cerca case: S/4,200 monthly fixed costs. Simplified result = volume × (price − variable cost) − 4,200.
| Scenario | Units/month | Price S/ | Variable cost S/ | Simplified result S/ |
|---|---|---|---|---|
| Severe downside | 260 | 36 | 28 | −2,120 |
| Conservative | 320 | 40 | 26 | 280 |
| Central | 400 | 40 | 26 | 1,400 |
| Favorable | 560 | 42 | 25 | 5,320 |
In the central case, 400 × (40 − 26) − 4,200 = S/1,400. In the favorable case, 560 × 17 − 4,200 = S/5,320. The table does not include taxes, initial investment, financing, depreciation, or step increases in fixed costs; these numbers are not forecasts or net profit. Variable costs change by scenario as an assumption, not as guaranteed efficiency.
Step 3. Check capacity constraints
If theoretical capacity is 22 lunches per day over 26 days, the maximum is 572 per month, with no interruptions. The favorable case's 560 units use about 97.9% of that theoretical capacity. Ask whether storage, production, delivery, and suppliers can sustain the load. A spreadsheet cannot overcome physical capacity without adding resources and costs. See the capabilities map.
Step 4. Change one variable at a time to understand sensitivity
Holding the central case constant (400 units, S/40 price, S/26 variable cost, S/4,200 fixed costs), lowering price to S/38 reduces the result from S/1,400 to S/600 if volume stays constant, an unverified assumption. Raising variable cost to S/28 also reduces it to S/600, all else equal. Reducing volume to 300 leads to S/0. This analysis does not assign probabilities; it shows which assumptions matter to the arithmetic [R19].
When a highly influential variable is still supported by weak evidence, use the guide to prioritizing the riskiest hypotheses to choose what to investigate first. Sensitivity shows the numerical impact; learning priority also considers uncertainty and the cost of being wrong.
Step 5. Separate simplified operating result from available cash
A corporate contract may increase recorded sales while delaying cash collections. Prepare a separate calendar covering opening cash, expected receipts, supplier and payroll payments, reserves, and investment. IAS 7 separates operating, investing, and financing cash flows [R14]. Do not infer liquidity from a positive result in the scenario table.
Step 6. Explore a useful worst case, not an imaginary apocalypse
Ask what plausible problems could coincide: delayed payments, a failed key supplier, extra waste, or falling orders. Identify which condition would make the promise impossible, how much cash might be required, and which part of the model could be redesigned. Detailed operational contingency planning belongs to pillar 4; testing major unknowns belongs to pillar 3.
If the downside case includes identifiable operational failures, explore how to design risk responses and contingency plans. A scenario describes possible consequences; a practical response defines activation signals, owners, resources, and limits.
Step 7. Decide, document, and return to the model
Available decisions include continuing with explicit assumptions, redesigning pricing/channel/service, seeking more evidence, reducing dependency, or abandoning the configuration. Do not use a favorable scenario to justify fixed spending that only works when everything goes right. Compare with critical evidence evaluation and opportunity assessment.
When different outcomes lead to different actions, use a decision tree and document the next business-model iteration.
Once a scenario is selected for the next step, compare its projected profit with the cash-flow and reserves forecast. Recognized sales are not available cash: translate collection timing, prepaid expenses, and working capital needs into verifiable decisions before operating.
Frequent mistakes and limitations
Assigning probabilities without data; changing scenario costs without explaining why; forgetting taxes, investment, and working capital; exceeding physical capacity; confusing break-even with positive cash; or declaring a spreadsheet “viable” while omitting legal and operating risks. A scenario does not validate demand.
Decision rules after building the table
Do not write “approved” merely because the central case is positive. Ask whether the conservative case leaves sufficient contribution, whether the downside requires cash you do not have, and whether the upside exceeds real capacity. For each scenario write a conditional decision: “If unit contribution falls below S/10, we will revisit channel and price,” or “If delivery cannot exceed 15 orders daily, we will not accept 20.” These thresholds are hypothetical management examples, not universal recommendations or guarantees. Each decision needs an action, an owner, and the observation that triggers it.
What you should have when you finish
Four consistent scenarios, assumptions with sources, capacity check, sensitivity of key variables, cash warnings, risks, and a documented design decision. Sources: [R13][R14][R19][R01].
Bibliography and references
- [R13] OpenStax — Managerial Accounting, Chapter 3 Summary. https://openstax.org/books/principles-managerial-accounting/pages/3-summary — Margen de contribución, punto de equilibrio, mezcla y sensibilidad.
- [R19] OpenStax — Break-Even Sensitivity Analysis. https://openstax.org/books/principles-managerial-accounting/pages/3-3-perform-break-even-sensitivity-analysis-for-a-single-product-under-changing-business-situations — Cambios de precio, volumen y costos en escenarios.
- [R14] IFRS Foundation — IAS 7 Statement of Cash Flows. https://www.ifrs.org/issued-standards/list-of-standards/ias-7-statement-of-cash-flows/ — Clasificación de flujos operativos, de inversión y financiación.
- [R01] Strategyzer — The Business Model Canvas. https://www.strategyzer.com/library/the-business-model-canvas — Nueve bloques interdependientes y uso iterativo del Canvas.