Data cannot make decisions for us. After a test, we must still decide whether to continue, change, investigate further, or abandon an approach. A decision tree represents options, possible outcomes, and consequences, making decision criteria visible. The Open University uses decision trees to organize choices under uncertainty, including probabilities and values when evidence allows their estimation [R14].
What belongs in a decision tree
A decision node represents a choice we control: continue or repeat. An outcome node represents something that may happen: adequate adoption, poor adoption, or inconclusive results. A branch connects a condition to an action and its consequences. Do not confuse this with a schedule or task flowchart: a decision tree represents alternatives conditioned on evidence.
Start with the pending decision
Write down the investment at stake: “Should we allocate resources to expand the pilot to twenty restaurants?” Recover the original hypothesis, criterion, cost of proceeding, and conditions under which additional testing would be valuable. Documenting results preserves the required context.
Three outcomes: favorable, unfavorable, and inconclusive
- Evidence sufficient for a bounded decision: a justified threshold is met with no critical contradiction. It may support an incremental step, not unrestricted launch.
- Unfavorable evidence: the condition is not met under a valid procedure. Consider adjusting the offer, testing a different claim, or rejecting the current design.
- Inconclusive evidence: too few participants, major incidents, unequal exposure, or missing metrics. Improve the test rather than declaring success or failure.
A tree should not force a binary answer when evidence is insufficient.
Example using pilot findings
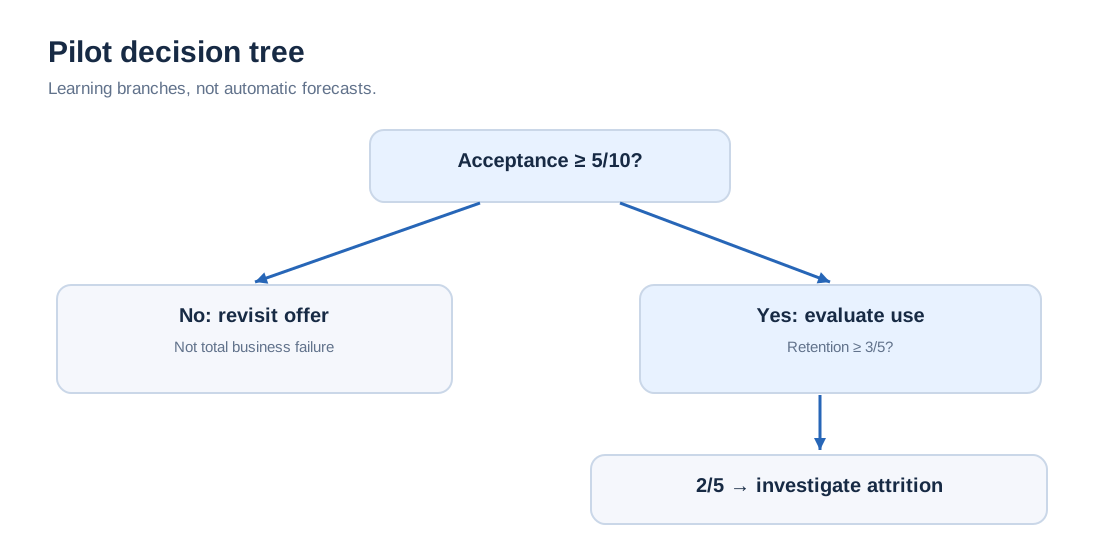
Return to the hypothetical analysis of ten restaurants: six accepted ten offers; five activated; only two of those five were still active on day fourteen; there was no paid offer.
- Node A — Was the planned acceptance threshold of 5/10 reached? Yes, 6/10. This does not establish payment, so commercial expansion is not yet authorized.
- Node B — Did at least 3 of the 5 activated venues remain active on day fourteen? No: 2/5 remained. This second threshold is a hypothetical teaching criterion, not one defined by Strategyzer.
- Provisional decision: investigate attrition and redesign the experience before expanding.
- Node C — Did the problem persist in a better-designed follow-up? If so, reconsider the offering or segment. Otherwise, plan a transparent paid-offer test.
When to use costs and probabilities
Formal decision analysis may use expected value: sum the probability of each outcome multiplied by its financial consequence. For example, 0.3 × S/1,000 + 0.7 × (−S/500) = −S/50. These are illustrative probabilities and figures, not actual forecasts. Do not invent probabilities and present their result as scientific certainty. Without defensible estimates, use qualitative branches with known limits and thresholds [R14].
If you need to examine how changes in sales, prices, or costs affect the business without inventing probabilities, see how to assess business-model viability scenarios. Scenario sensitivity is different from assigning probabilities to each decision-tree branch.
Reversible decisions and stopping criteria
Changing invitation wording is usually reversible; contracting expensive infrastructure may not be. The less reversible the commitment, the more care the evidence deserves. Set a budget limit or condition to stop repetitive testing. Additional research loses value if no plausible observation would change your course.
When a hard-to-reverse choice also exposes the business to operational or financial threats, use the risk-assessment matrix to document consequences, signals, and owners. A decision tree organizes evidence-dependent choices; the matrix examines risks requiring treatment during execution.
When the decision tree suggests “proceed,” the plan still needs a launch-readiness Go/No-Go review. This confirms operational, legal, and cash conditions with concrete evidence rather than mistaking a supported hypothesis for permission to launch.
Record why a branch was chosen
Document date, version, owners, evidence, original criterion, residual risks, and next review. If the tree changes after seeing results, state why. The next decision can feed another iteration or return to hypothesis prioritization.
What you should have by the end: a visual tree connecting explicit conditions, actions, and consequences without inventing certainty. Main sources: [R14], [R03], [R05], [R06].
Bibliography and references
- [R14] The Open University/OpenLearn. Decision trees and dealing with uncertainty. https://www.open.edu/openlearn/mod/oucontent/view.php?id=106421 — Árboles de decisión, resultados y valor esperado.
- [R03] Strategyzer. Validate Your Ideas with The Test Card. https://www.strategyzer.com/library/validate-your-ideas-with-the-test-card — Hipótesis, prueba, métrica y umbral.
- [R05] Strategyzer. Capture (Customer) Insights and Actions with the Learning Card. https://www.strategyzer.com/library/capture-customer-insights-and-actions-with-the-learning-card — Resultados, aprendizaje y acciones.
- [R06] Strategyzer. How to design and test business ideas. https://www.strategyzer.com/library/the-role-of-an-effective-innovation-coach — Design–Test Loop, pivotar, perseverar o abandonar.