A schedule does not create time: it shows when defined, estimated work may be done under realistic operating conditions.
From task inventory to dates
A list says what must be done. The WBS identifies outcomes, duration estimates indicate how long activities might take, and the dependency network orders them. A schedule brings these together with calendars, availability, restrictions and ownership. A Gantt chart displays activities as bars over time; a simplified timeline may display only milestones. Neither replaces a clear definition of the work.
Before filling in the Gantt chart, distinguish task dates from acceptance outcomes using the milestones and MoSCoW scope guide. A milestone marks a checkable condition and normally has zero duration; do not stretch it into a long task merely to fill a timeline.
Build a traceable schedule
- List coded activities and expected outputs.
- Add estimated duration, owner and predecessor IDs.
- Define the working calendar: operating days, available hours and actual public holidays in the relevant jurisdiction.
- Calculate earliest starts from predecessor finishes, using the latest finish where multiple predecessors exist.
- Enter zero-duration milestones, such as “tests accepted”; do not invent a week-long task just to display a milestone.
- Check equipment and people. Reorder incompatible simultaneous work or obtain additional capacity.
- Include externally controlled deliverables with explicit commitments and confirmation states.
- Establish an approved baseline and reasoned target date, not a guarantee.
Example: ten abstract working days
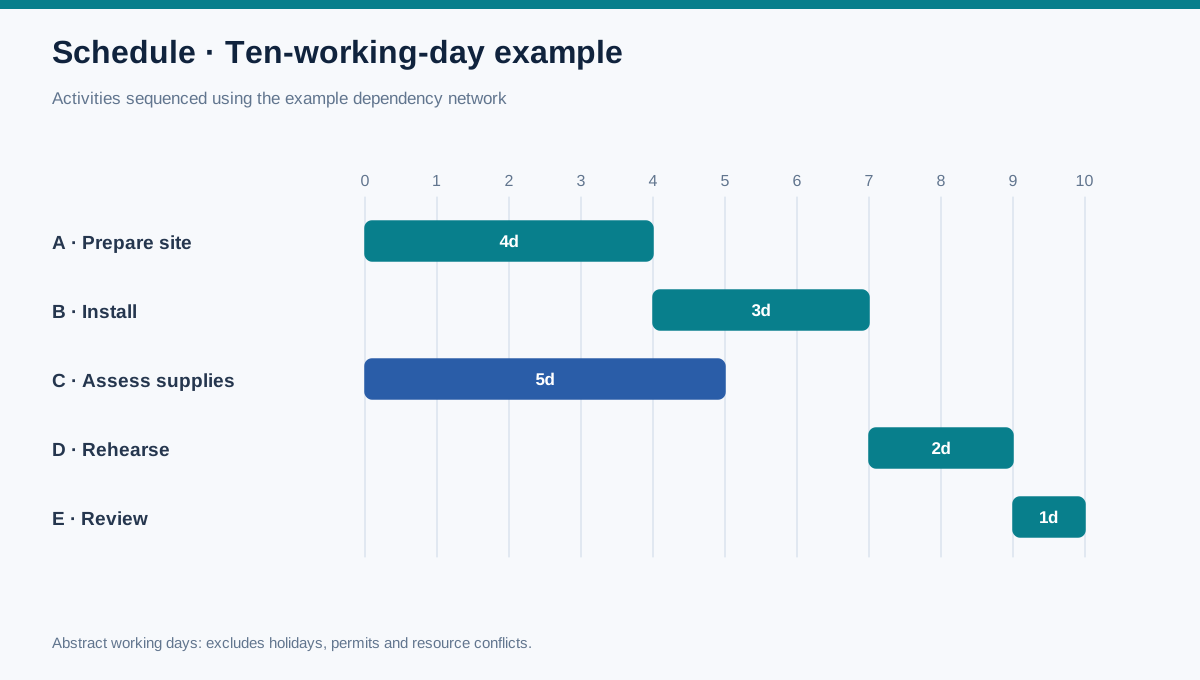
Use the critical-path example: workspace A from day 0–4, installation B from 4–7, supply assessment C from 0–5, rehearsal D from 7–9 and review E from 9–10. The A–B–D–E path gives theoretical completion at day 10. This is an example in abstract working days, not a real opening date. Unknown regulatory lead times are not included.
| Activity | Start | Finish | Depends on | Illustrative owner |
|---|---|---|---|---|
| A. Prepare workspace | 0 | 4 | — | Operations |
| B. Install equipment | 4 | 7 | A | Technician |
| C. Evaluate supplies | 0 | 5 | — | Procurement |
| D. Rehearse | 7 | 9 | B and C | Kitchen lead |
| E. Review | 9 | 10 | D | Founder |
From the table to a working spreadsheet
Minimum columns are code, activity, start date, working-day duration, finish date, predecessors, owner, state and baseline. In a simple case, a finish date can be derived from a start and working-day count. A project with several dependency types and shared resources benefits from software that models the network explicitly. Writing finish = start + duration alone ignores weekends, shifts, public holidays and multiple predecessors.
Preserve a Gantt view, milestone list and external-constraints section. The workbook bundled with this package provides an educational example and editable fields; it is not presented as a universal scheduling engine.
Tracking, variance and re-planning
Compare baseline and actual to recognize slippage, new obligations, supplier delays and revised estimates. Ask whether a delay consumes float, changes the critical path, overallocates staff or requires changing scope. A task sitting at “90% complete” for weeks is not proof of progress: record the missing outcome and its acceptance criterion.
Plan contingency openly instead of hiding spare time in every bar. Where a supplier delay could block a delivery, define the trigger and action in the contingency plan. Review schedules when assumptions change, not only at month end.
Errors and limits
A polished Gantt can still be unrealistic if it assumes impossible availability. Resource leveling can change the initially calculated critical path. An externally controlled permit date is not certain until confirmed. Avoid arbitrary dependencies and precision beyond the evidence.
If overlapping bars compete for a critical person, machine, or facility, return to resource availability and capability gaps before approving dates. A visual Gantt chart cannot replace capacity leveling and a review of actual constraints.
Calendar example: working days are not calendar dates
The original dependency diagram uses abstract working days 0–10. That is not yet an operational calendar. For a reproducible illustration, set Tuesday, December 1, 2026 as a fictional starting date. Without holidays or resource shortages, the activities become:
| Activity | Workdays | Predecessors | Illustrative early start | Illustrative early finish | Logical float |
|---|---|---|---|---|---|
| A: fit out | 4 | — | Tue Dec 1 | Fri Dec 4 | 0 |
| B: install | 3 | A | Mon Dec 7 | Wed Dec 9 | 0 |
| C: evaluate supplies | 5 | — | Tue Dec 1 | Mon Dec 7 | 2 |
| D: rehearse | 2 | B and C | Thu Dec 10 | Fri Dec 11 | 0 |
| E: review | 1 | D | Mon Dec 14 | Mon Dec 14 | 0 |
Warning: this teaching calendar deliberately excludes Peruvian public holidays, special shifts, actual time off, and administrative delays. Before using it in a real business, choose an approved start date, load the team's actual calendar, and check resource assignments. The example does not promise a December 14 launch.
The DatedGantt tab calculates working-day dates with WORKDAY, tracks a baseline finish separately from actual finish, and calculates variance. A baseline is approved reference information: if an approval takes longer, record the cause and decision before changing it. A milestone is a zero-duration verification event in the schedule model, not an invented one-day task. Recalculate the critical path after resource leveling, waiting periods, or scope changes; C having float does not mean it needs no monitoring.
What you should have when you finish
An editable schedule, checkable milestones, an approved baseline, initial critical path, reviewed availability and a simple change log.
References: [R05], [R04], [R17].
Bibliography and references
- [R05] PMI — Practice Standard for Scheduling — Second Edition. https://www.pmi.org/-/media/pmi/documents/public/pdf/certifications/practice-standard-scheduling.pdf?v=c7ca2721-8c26-4e07-ba47-069d0987bc0c
- [R04] Association for Project Management — What is scheduling in project management?. https://www.apm.org.uk/resources/what-is-project-management/what-is-scheduling-in-project-management/
- [R17] Association for Project Management — 7 common project scheduling mistakes and how to avoid them. https://www.apm.org.uk/blog/7-common-project-scheduling-mistakes-and-how-to-avoid-them/